
A token page says "$10 million market cap." Your sale quote says something much less exciting. Both numbers can be correct.
For anyone trying to read a token page or swap quote, crypto market cap vs liquidity comes down to this: valuation multiplies a price by a supply estimate; a sale needs buyers or pool reserves. Here are fictional examples you can check with a calculator. They are not live quotes or recommendations to trade.
Market cap: one price multiplied by many tokens
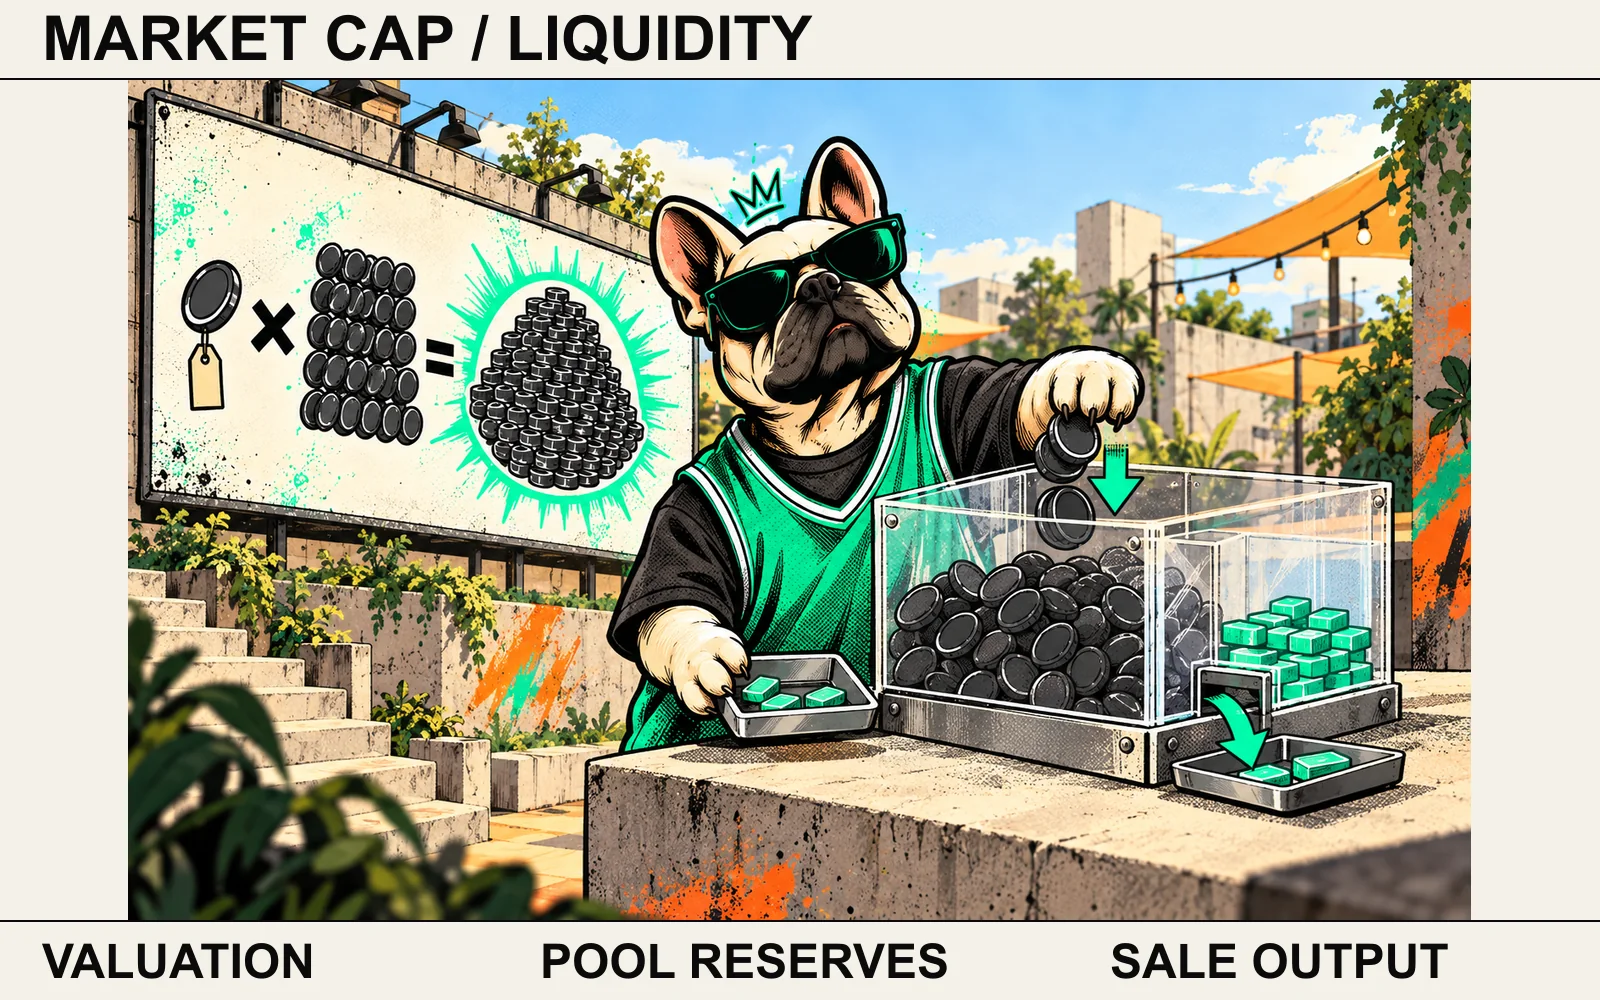
CoinGecko's methodology calculates circulating market cap as price × circulating supply. Its displayed price aggregates market data; it is not necessarily a quote for your whole order on one exchange.
Imagine token T costs $2 and has 5,000,000 tokens in circulation:
$2 × 5,000,000 T = $10,000,000 market cap
If the displayed price rises to $3 with the same supply estimate, market cap becomes $15 million. That calculation alone does not establish that another $5 million entered the market. It applies the new price to every circulating token.
The figure does not count cash deposited by holders or bids waiting to buy their tokens. Before comparing valuations, check the price source, supply definition and timestamp.
Liquidity: how much can trade, and at which prices?
An order book lists buy and sell orders. If you are selling, the relevant side is the bids: what buyers offer and how much they want. A top price without quantity tells only half the story.
Consider this fictional continuous-market snapshot. Assume no fees, no competing orders and no changes before matching.
| Bid price per T | Quantity buyers want | Proceeds at that level |
|---|---|---|
| 2.00 quote units | 100 T | 200 quote units |
| 1.90 quote units | 200 T | 380 quote units |
| Both levels | 300 T | 580 quote units |
A sale of 300 T against these bids produces 100 × 2.00 + 200 × 1.90 = 580 quote units. Multiplying the top price by the whole order would suggest 600. The average execution price is about 1.9333 quote units per T.
A $10 million market-cap field adds no extra bid to that book. We also cannot calculate a 3,000 T sale from these two levels: the remaining depth is unknown.
Coinbase Exchange's product-book documentation distinguishes the best bid and ask from fuller depth. In its aggregated levels, size already sums orders at each price; multiplying it by the order count would double-count quantity. Its auction quotes are indicative, so they need different treatment from continuous-market orders.
These are documented data fields, not a live Coinbase test. Orders can change before execution; the matching-engine documentation describes orders remaining open until filled or cancelled.
A pool's total value is not the amount available to sell into
An automated market maker, or AMM, prices trades against pool state. Uniswap's protocol overview explains two-asset reserves and the constant-product model. Let's use a simplified, fee-free pool, not an actual Uniswap quote.
Our pool starts with 10,000 T and 20,000 units of quote token Q. For this example only, one Q is worth $1. Q is fictional, not a named stablecoin or a promise of dollar redemption.
The starting ratio is 20,000 Q / 10,000 T = 2 Q per T. The constant product is 10,000 × 20,000 = 200,000,000.
Now sell 1,000 T into the pool. The T reserve becomes 11,000. Holding the product constant leaves:
200,000,000 / 11,000 ≈ 18,181.82 Q
The seller receives 20,000 − 200,000,000 / 11,000 ≈ 1,818.18 Q, before the fees we deliberately left out. Figures are rounded for display; the calculation uses the unrounded fraction.
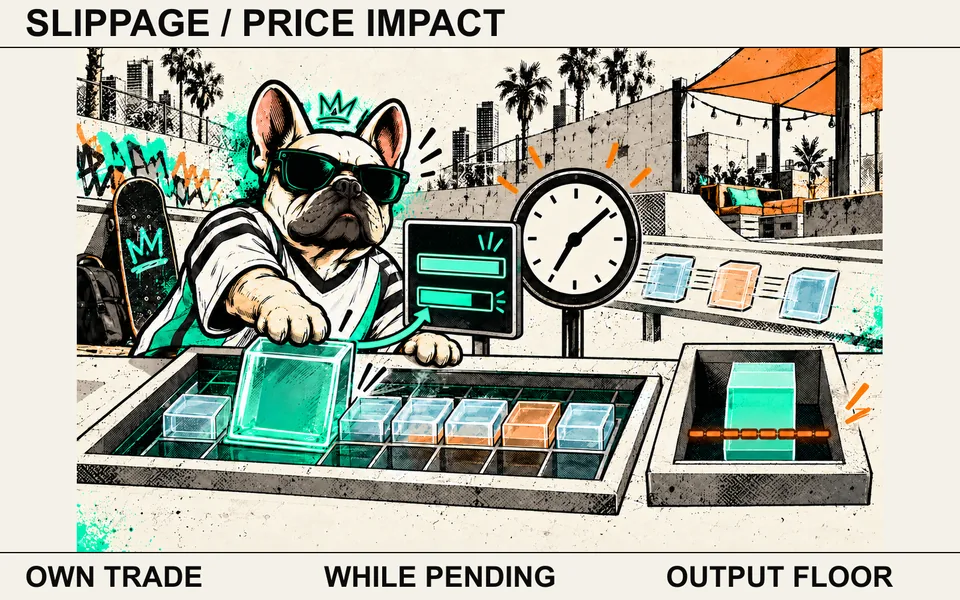
At the starting ratio, 1,000 T looked worth 2,000 Q. The actual average in this example is about 1.8182 Q per T because the trade changes the reserve ratio. That is the order's own price impact, not a mysterious "market cap fee." Uniswap's price-impact explanation relates this effect to trade size and available liquidity.
Both starting reserves are worth $40,000 at our assumed spot ratio: $20,000 of T plus $20,000 of Q. There are only 20,000 Q in the pool, and even that balance is not available for an unlimited T sale at the starting price. Pool value, reserves in the asset you want, and executable depth are different quantities.
Actual quotes also depend on fees, routes and token behaviour. Concentrated liquidity adds price ranges, as Uniswap's overview explains. A total-value figure does not tell you how much liquidity is active along your order's route.
Volume and FDV answer two other questions
Volume describes completed trading over a stated period. CoinGecko's methodology explains its rolling 24-hour volume and aggregation across markets. It is past activity, not a pile of open bids waiting now.
The same 100 units traded ten times can contribute 1,000 units of turnover. That arithmetic says nothing about whether the next order can trade 1,000 units at one price. It is not an allegation of wash trading by any project.
Fully diluted valuation, or FDV, applies a price to a broader supply basis. CoinGecko's FDV guide uses total supply. Elsewhere, read the field's definition before assuming it uses total or maximum supply.
Suppose T has 20,000,000 total tokens, none burned, and a maximum of 20,000,000, but only 5,000,000 circulate. At our assumed $2 price:
| Figure | Supply used | Calculated value |
|---|---|---|
| Circulating market cap | 5,000,000 T | $10,000,000 |
| FDV using total supply | 20,000,000 T | $40,000,000 |
| FDV using maximum supply | 20,000,000 T | $40,000,000 |
The two FDV bases happen to match here. They need not match for a real asset, and a predetermined maximum may not exist. FDV does not promise a release date, future price or buyers for newly circulating tokens.
What to check beside a big headline valuation
Keep the network, exact token, trading pair, direction, order size and timestamp together. Then ask:
- Which price and circulating-supply estimate produced the market cap?
- For a sale, how much bid depth or quote-side pool liquidity supports this size?
- Does the quote include the complete order, fees and route, rather than a tiny sample multiplied up?
- Does "volume" cover this pair, this venue or an aggregate across markets?
- Will the proceeds be another token or an exchange balance, and what separate withdrawal or redemption conditions apply?
There is no universal "safe liquidity" ratio here. A venue you cannot access or a different token with the same ticker does not establish an exit for your asset.
For the short definitions, see market cap, liquidity and FDV. Slippage vs price impact explains why quotes change; the meme-coin guide covers concentration and thin markets.
The useful question is how a specific quantity can trade on a specific route. The big valuation number cannot answer it for you.
Sources
Documentation checked 10 October 2026. All numerical examples are fictional and independently calculated. This guide does not measure live depth, test a trading service, give investment advice or promise country-specific access. Named providers illustrate their documented fields and mechanisms, not endorsements.
- CoinGecko: Methodology — price aggregation, circulating market cap and volume scope.
- CoinGecko: Fully diluted valuation — its total-supply calculation, not a future-price guarantee.
- Coinbase Exchange: Product book — depth, aggregated sizes and indicative auction quotes.
- Coinbase Exchange: Matching engine — matching and order lifecycle.
- Uniswap: How the protocol works — pool reserves, constant product and concentrated liquidity.
- Uniswap: Price impact — effects of order size relative to liquidity.
See something wrong? Brokzi logs material changes. Prepare a correction note.